33 free animated React components via the shadcn CLI, with WebGL effects
Bklit UI
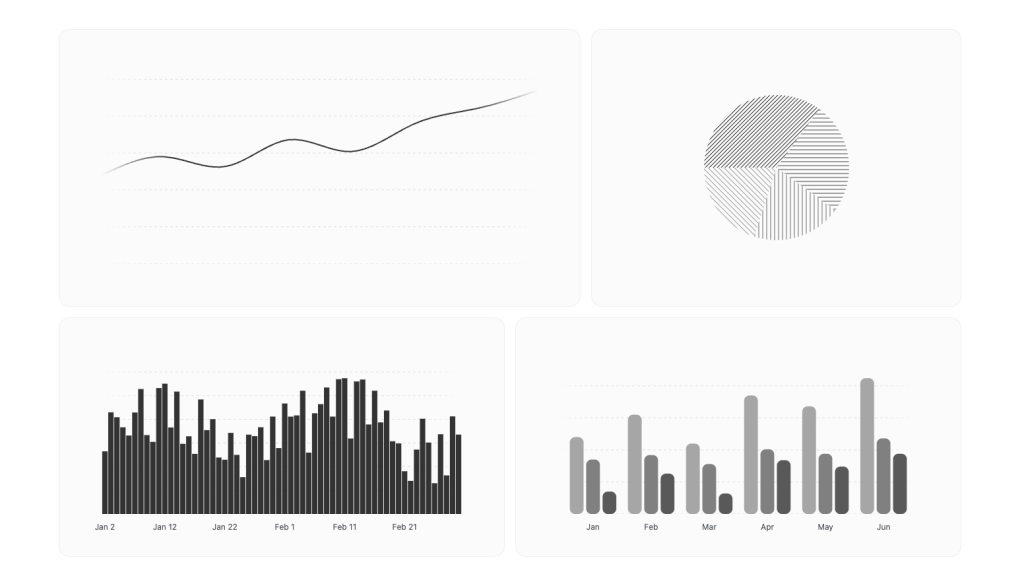
20 free shadcn/ui chart types on d3 and Motion, with 235 examples and a Studio
FreeComponents
ui.bklit.comExplore the product
AT A GLANCE
- Website
- ui.bklit.com
- Pricing
- Free
- Categories
- Components
- Listed
- Mar 2026
- Updated
- Nov 2026
Details about Bklit UI
KEY POINTS
- Open source
- Tailwind CSS v4
- Theming
- Dark mode
- Animated
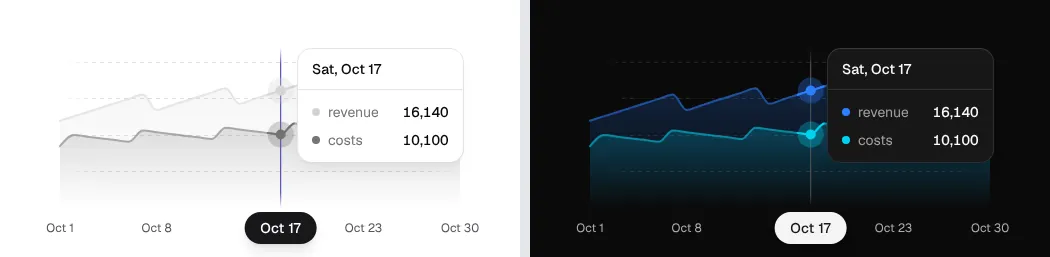
Short verdict: Bklit UI is a free, MIT-licensed set of 20 animated chart types for React that installs through the shadcn CLI, with 235 ready-made examples and a hosted Studio for tuning them. The area, funnel and map charts we installed looked polished in a Next.js 16 app and followed our theme in light and dark mode. But the first production build failed until we added four d3 type packages, the docs import from a package that does not exist, and the world map stayed blank until we moved it into a client component. It suits React teams on shadcn/ui who want more chart types and more polish than Recharts-based defaults. Skip it if you want a versioned npm package with predictable upgrades, or charts that screen readers can read without extra work.
How we reviewed it: On 22 November 2026 we created a Next.js 16.4.6 app with shadcn CLI 4.23.0 (React 19.3, Tailwind CSS 4), installed the area, funnel and choropleth charts from the @bklit registry as the installation page describes, built test pages from the docs' usage examples and ran a production build. We used each chart at 1,280 and 390 px, in light and dark mode, while logging network requests. We counted the components and gallery examples on ui.bklit.com, tried Studio, and ran Lighthouse 12.8.2 once on two docs pages. We did not test the React Native charts, which are in beta, other frameworks or large datasets. License, activity and size figures come from the docs, the registry and the GitHub repository on the same day.
What Bklit UI includes
| Price | Free. There is no paid edition; the project is funded by sponsors. |
|---|---|
| License | MIT for the chart library. Studio, the hosted chart editor, has its own all-rights-reserved license: free to use on the site, but its source may not be reused or redistributed. License |
| Size | 20 chart types, from area, bar and line to candlestick, choropleth map, funnel, gauge, sankey, sparkline and sunburst, plus 15 utilities such as tooltip, legend, brush, markers and trend line. The gallery has 235 examples on 19 chart pages; we counted 235, matching Bklit's figure. The registry also holds three stat-card blocks. |
| Stack | React 18 or 19, Motion for animation and d3 modules (d3-shape, d3-scale, d3-array, d3-geo) for scales and shapes. Bklit replaced visx with plain d3 on 31 October 2026. Theme tokens are written for Tailwind CSS 4. Line and area charts for React Native, drawn with Skia, are in beta. |
| Install | shadcn CLI with the @bklit namespace, or copy each file by hand. shadcn's registry index rates @bklit healthy, with 99.7% availability over 30 days. There is no npm package. |
| Activity | 601 commits since 19 January 2026, 98 of them in the 30 days before our test; latest commit 15 November 2026. One author made 147 of the 152 commits in the last 90 days. About 2,000 GitHub stars, per the site. |
| Extras | Studio, a Recipes gallery of chart treatments with prompts for coding agents, four agent skills (npx skills add bklit/bklit-ui) and an in-browser benchmark against Recharts and TanStack Charts. |
What we found
Installing copies a lot of code
The namespace needed no setup: the first npx shadcn@latest add @bklit/area-chart added @bklit to components.json by itself. The area chart then copied 79 files, about 15,000 lines, including the shared tooltip, axes, grid and loading animations. The funnel added one file of 1,048 lines and the choropleth 27 files, so three charts came to 107 files and about 21,500 lines that you now own. The CLI also merged about 30 chart color tokens for light and dark mode into globals.css.
Each chart also brings Bklit's own copy of shadcn's cn helper, so the CLI asked to overwrite lib/utils.ts. The --yes flag does not answer that question, and in our non-interactive shell, as in CI or some coding agents, the CLI stopped there without writing any chart files. Answering No keeps your file and works, because both versions export the same cn.
The first production build failed
The registry installs d3-shape, d3-scale, d3-array and d3-geo, but not their TypeScript type packages. In our strict TypeScript project that meant 27 type errors inside the copied chart files, and next build stopped with "Failed to type check". Adding @types/d3-array, @types/d3-geo, @types/d3-scale and @types/d3-shape as dev dependencies fixed it. Bklit's own repository lists those four packages, which is why its builds pass.
The usage examples on every component page import from @bklitui/ui/charts, a package that is not on npm and that the CLI does not create. Installed charts are imported file by file, for example from @/components/charts/area-chart or @/components/charts/choropleth; there is no index file. The theming page and the agent skills mention the local paths; the component pages do not.
Charts follow your theme, which may be grey
Bklit only adds the color variables your theme lacks. A new shadcn project already defines --chart-1 to --chart-5, and in the default neutral theme those are greys, so our charts came out grey rather than the indigo, yellow and purple on the Bklit site. Pasting the palette export from the theming page into globals.css recolored every chart without reinstalling, and dark mode followed the .dark class with no extra work. The site offers six palettes and a color editor that exports this CSS.
The map needs a client component and your own map data
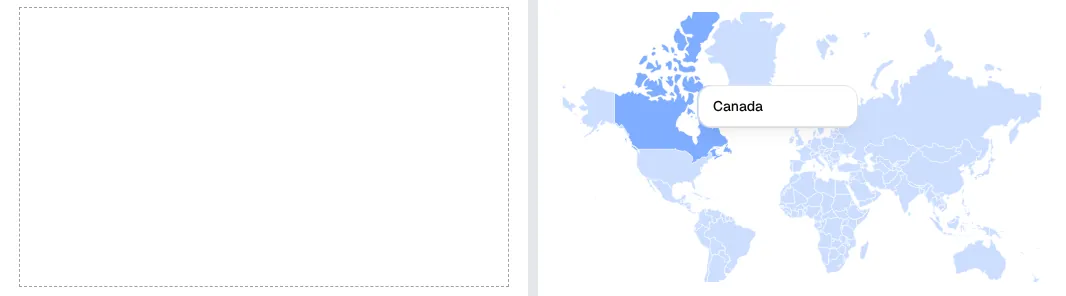
The choropleth takes a GeoJSON collection, and its usage example leaves loading one to you, so we used the countries file from the world-atlas package. Pasted into a Next.js page, which is a server component by default, the chart drew an empty box with no error message. The chart sorts its children by component type, and that check fails once the children cross from server to client. Moved into a "use client" component, the same code drew 177 countries, and hovering Canada showed its tooltip.
Bklit's own map demos and its choropleth stat-card block fetch the world map at runtime from the master branch of a third-party GitHub repository. In production, host a fixed copy of the map data you choose.
Studio, recipes and 235 examples
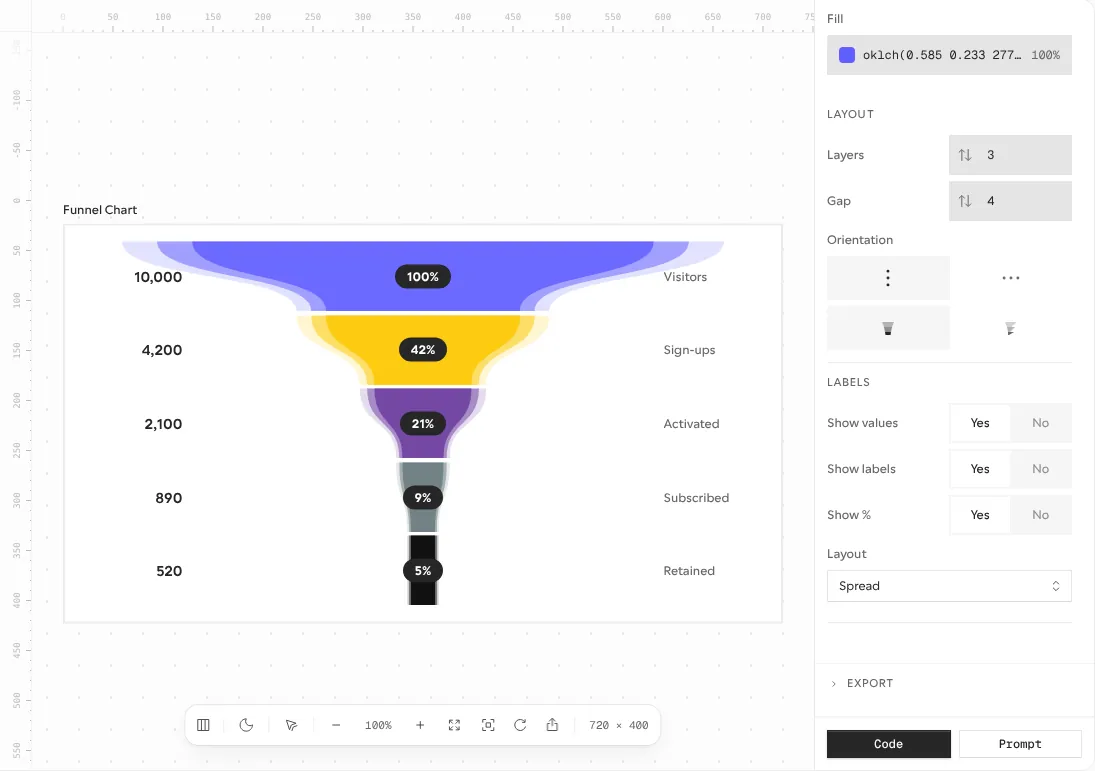
Every gallery example has View code and Open in Studio buttons. Studio shows the chart with its layers, enter animation and props in side panels. Code exports the install command, the usage snippet and the data, and Share gives a link or an embed. One gap: the Code export says enter-animation settings are not included yet, so you copy those by hand. Recipes, added on 22 October 2026, applies one look, such as squircle bars or faded pattern backgrounds, across several chart types, with a prompt for coding agents.
Charts are hidden from screen readers
Every chart SVG we installed carries aria-hidden="true" and no label or title. The funnel's values and stage names are HTML text, so a screen reader still gets them, but the area chart exposes only its x-axis dates and the map nothing at all. Plan a short text summary or a data table next to each chart.
Performance: your bundle and the docs site
JavaScript per page in our production build, gzipped:
| Test page | JavaScript |
|---|---|
| Blank page | 133 KB |
| Funnel chart | 204 KB |
| World map (map data sent separately) | 250 KB |
| Area chart with grid, x-axis and tooltip | 257 KB |
The area chart added about 124 KB over a blank page and the funnel about 71 KB. Those numbers include Motion, which Bklit leaves out of its own figures (53.3 KB for a line chart and 188.8 KB for the whole library, per its 31 October changelog). Lighthouse measures the documentation site, not your app. One run per page, Lighthouse 12.8.2, 22 November 2026:
| Page | Performance | Accessibility | Best practices | SEO |
|---|---|---|---|---|
| Home, mobile | 53 | 100 | 96 | 100 |
| Home, desktop | 97 | 100 | 96 | 100 |
| Funnel chart docs, mobile | 64 | 100 | 100 | 100 |
| Funnel chart docs, desktop | 85 | 100 | 100 | 100 |
On mobile the home page loads about 1 MB of JavaScript, with 1.25 s of total blocking time and a 4.7 s largest contentful paint. Its best-practice score lost points to a rate-limited GitHub API call and a missing avatar.
What you still have to build
Data plumbing. Charts take arrays of rows; fetching, aggregating and formatting numbers and dates is your code.
Map data. Choose, license and host your own GeoJSON or TopoJSON; the docs only show the parsing step.
Client components. Keep chart compositions, the map at least, inside
"use client"files.Text alternatives. Add a summary or a table for each chart, since the SVGs are hidden from assistive technology.
Updates. Copied files do not update themselves. Re-add charts with
--overwriteand re-apply your edits; Bklit's guide for the move from visx includes a prompt that does this with a coding agent.
Pros and cons
Pros
20 chart types, including a map, sankey, sunburst, gauge and live line chart, well beyond the usual area, bar and pie set.
Theming through CSS variables: one pasted palette recolored every chart, and dark mode needed no changes.
235 examples, Studio and Recipes, so you start from a finished look rather than a bare chart.
MIT code you own, from a very active project: 98 commits in the 30 days before our test.
Cons
Our first production build failed until we added four d3 type packages.
The docs import from a package that does not exist, and the map renders nothing in a server component, without an error.
Heavy: the area chart alone copied about 15,000 lines and added about 124 KB of JavaScript.
Charts are hidden from screen readers.
Fast-moving internals: the 31 October switch to d3 changed imports and class names in edited files.
How Bklit UI compares
shadcn/ui charts are free, MIT-licensed and built on Recharts, with area, bar, line, pie, radar and radial examples. Pick them for standard dashboard charts with fewer moving parts; pick Bklit for maps, funnels, sankeys and a more designed, animated look.
Tremor, whose team has joined Vercel, offers 35+ open-source chart and dashboard components on Recharts and Radix UI, and its 300+ blocks and templates are now free as well. Pick it if you need whole dashboard screens, filters and KPI cards, not only charts.
See all open-source component libraries for more options.
Who should use Bklit UI
Use it if you build a React dashboard or analytics product on shadcn/ui and are happy to own the copied code. Budget time for the type packages, the import paths and client components, and plan text alternatives for screen readers. Look elsewhere if you want a versioned npm package with predictable upgrades, a stack other than React, or the smallest possible bundle.
FAQ
Is Bklit UI free for commercial projects?
Yes. The chart library is MIT-licensed, so you can use it in commercial and client projects. Only Studio, the hosted chart editor, has a separate license that forbids reusing its source code.
Do I need shadcn/ui to use Bklit UI?
You need the shadcn CLI setup, not shadcn's components. The CLI only needs a components.json file, and the charts style themselves with CSS variables and Tailwind classes. You can also copy each file by hand from the docs.
Why does my build fail after installing a Bklit chart?
In our test on 22 November 2026 the registry installed the d3 modules without their TypeScript types. Add @types/d3-array, @types/d3-geo, @types/d3-scale and @types/d3-shape as dev dependencies, and import charts from your components/charts folder rather than @bklitui/ui/charts.
Does Bklit UI work with React Native?
Partly. Line and area charts for React Native and Expo are in beta, drawn with React Native Skia and animated with Reanimated. Bklit says it has tested them on iPhone with Expo SDK 58; we did not test them.
Get new components like Bklit UI weekly
Every Monday: the templates, components and tools added to Tailkits that week, each checked by an editor. Free, unsubscribe in one click.
17 new in the last 30 days313 products reviewed so farSee what you get
KEEP EXPLORING
More components